
Soubor:Q-plate for OAM 1.svg

Velikost tohoto PNG náhledu tohoto SVG souboru: 439 × 599 pixelů. Jiná rozlišení: 176 × 240 pixelů | 352 × 480 pixelů | 563 × 768 pixelů | 750 × 1 024 pixelů | 1 501 × 2 048 pixelů | 2 500 × 3 411 pixelů.
Původní soubor (soubor SVG, nominální rozměr: 2 500 × 3 411 pixelů, velikost souboru: 1,33 MB)
| Tento soubor pochází z Wikimedia Commons. Níže jsou zobrazeny informace, které obsahuje jeho tamější stránka s popisem souboru. |
Popis
| Popis |
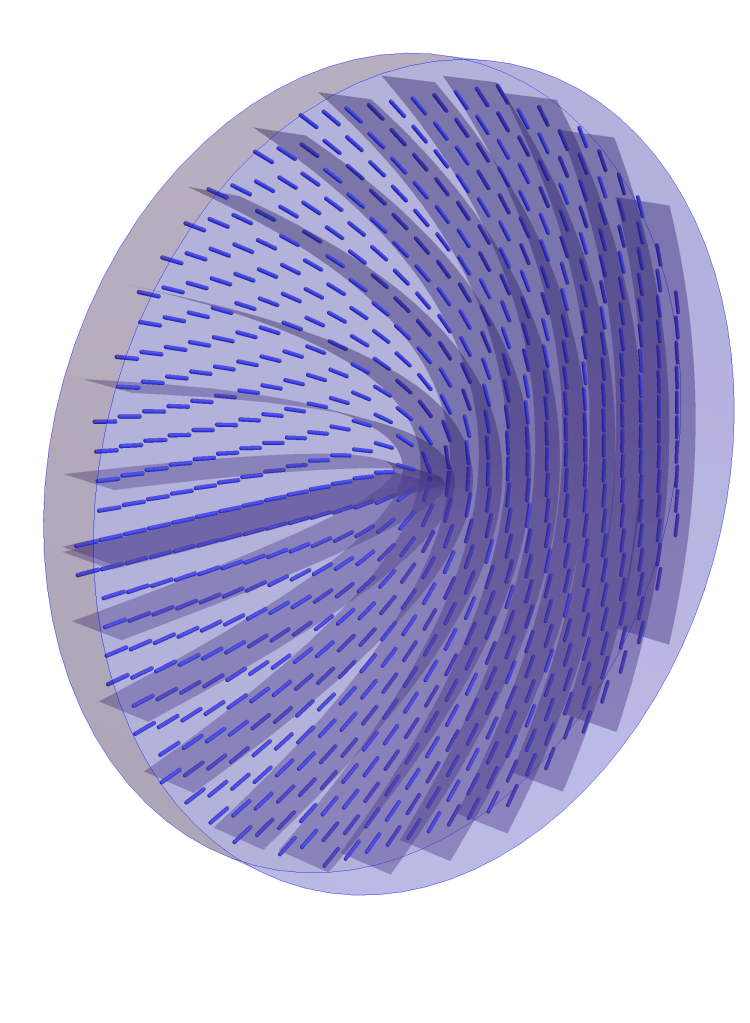
English: Schematic depiction of a q-plate with q = 1/2 that can be used to transform a circularly-polarized Gaussian light beam into a beam with helical wavefronts with a unit pitch. For details see: [Marrucci et al., Phys. Rev. Lett. 96, 163905, DOI:10.1103/PhysRevLett.96.163905]. Čeština: Schematické vyobrazení q-destičky s q = 1/2, jíž lze užít pro transformaci kruhově polarizovaného Gaussovského svazku světla na svazek se šroubovicovitými vlnoplochami s jednotkovým stoupáním. Pro bližší informace viz: [Marrucci et al., Phys. Rev. Lett. 96, 163905, DOI:10.1103/PhysRevLett.96.163905]. |
| Datum | |
| Zdroj | Vlastní dílo |
| Autor | JozumBjada |
Licence
Já, držitel autorských práv k tomuto dílu, ho tímto zveřejňuji za podmínek následující licence:
Tento soubor podléhá licenci Creative Commons Uveďte autora-Zachovejte licenci 4.0 International
- Dílo smíte:
- šířit – kopírovat, distribuovat a sdělovat veřejnosti
- upravovat – pozměňovat, doplňovat, využívat celé nebo částečně v jiných dílech
- Za těchto podmínek:
- uveďte autora – Máte povinnost uvést autorství, poskytnout odkaz na licenci a uvést, pokud jste provedli změny. Toho můžete docílit jakýmkoli rozumným způsobem, avšak ne způsobem naznačujícím, že by poskytovatel licence schvaloval nebo podporoval vás nebo vaše užití díla.
- zachovejte licenci – Pokud tento materiál jakkoliv upravíte, přepracujete nebo použijete ve svém díle, musíte své příspěvky šířit pod stejnou nebo slučitelnou licencí jako originál.
Source code
This figure was created using Wolfram language 12.0.0 for Microsoft Windows (64-bit) (April 6, 2019). The source code follows (formatted as a .wl package file).
(* ::Package:: *)

(* ::Title:: *)
(*Q-Plate*)


(* ::Subtitle:: *)
(*q-plate with q = 1/2*)


(* ::Input::Initialization:: *)
curve[a_,y_]:=-(1/2) E^(-2 a) (E^(4 a)-y^2)
avals=(1/2. Log[-2#])&/@{-1.5,-1.4,-1.3,-1.2,-1.1,-1.,-0.9,-0.8,-0.7,-0.6,-0.5,-0.4,-0.3,-0.2,-0.1,-4*^-2,-8*^-3,-1*^-5};
plot=Plot[Evaluate@Flatten@Table[curve[a,y],{a,avals}],{y,-1,1},PlotStyle->Darker@LightBlue,PlotRange->{-1,1},RegionFunction->(#1^2+#2^2<=1&),AspectRatio->1,Axes->False];


(* ::Input::Initialization:: *)
lines=Cases[InputForm[plot],_Line,Infinity];
lines=Show@RegionProduct[DiscretizeGraphics[lines],MeshRegion[{{0},{.2}},Line[{1,2}]]];
surfaces=GraphicsComplex[lines[[1,1]],lines[[1,2,-1]]];


(* ::Input::Initialization:: *)
plottubes=With[{f=1/2 ArcTan[y,-x]},VectorPlot[{Cos[f],Sin[f]},{x,-1,1},{y,-1,1},VectorMarkers->None,RegionFunction->(#1^2+#2^2<=1&),Frame->None,PlotRangePadding->None,VectorStyle->Thick,VectorScale->0.02,VectorPoints->30]];
tubes=Cases[InputForm[plottubes],_Line,Infinity];
tubes=tubes/.{x_?NumericQ,y_?NumericQ}:>{x,y,0.1}/.Line[l_]:>Tube[l,0.005];


(* ::Input::Initialization:: *)
qplate=Graphics3D[{
Lighter@Blue,tubes,EdgeForm[],Opacity[.4],Rotate[surfaces,- \[Pi],{0,0,1}],Opacity[.2],EdgeForm[Blue],Cylinder[{{0,0,0},{0,0,0.2}},1.05]
},ImageSize->2000,Boxed->False,Method->{"CylinderPoints"->80},ViewPoint->{-0.871,-2.1271,2.4871},ViewVertical->{-0.23839,-0.073117,0.96841}
];


(* ::Input:: *)
(*SetDirectory[NotebookDirectory[]]*)
(*Export["qplate.svg",gr]*)
Historie souboru
Kliknutím na datum a čas se zobrazí tehdejší verze souboru.
| Datum a čas | Náhled | Rozměry | Uživatel | Komentář | |
|---|---|---|---|---|---|
| současná | 26. 1. 2022, 22:32 | | 2 500 × 3 411 (1,33 MB) | JozumBjada | Cross-wiki upload from cs.wikipedia.org |
Využití souboru
Tento soubor používá následující stránka: